Comparing Means
RQ2: Do different ways of organizing groups lead to different
assessments of the outcome?
To answer this question, if you remember, I have created three variables. I have a nominal measure of how people prefer to organize their groups, and three ratio-level indexes measuring three different aspects of how people evaluate outcomes of group projects.
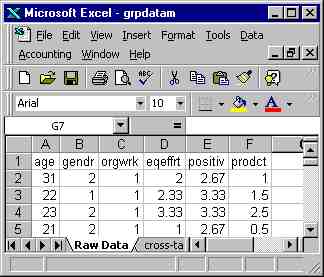
Using Excel, I begin by sorting my files by organization preference. (You will notice in the illustration below that I have deleted all the columns of data I won't be using for the sake of this illustration. If you decide to follow suit, be sure to save the new file in a different file, so you won't accidentally save it over the file with all your data!)
First, click on "data," then on "sort." In the "sort by" box, enter the variable name, "Orgwrk." Be sure that the button for "Header Row" is checked. Then do the sort. The result will look like the example to the left.
Now, let's compute means on each of the evaluation variables for each
value of "orgwrk." For convenience, I had Excel maintain the
header row in a separate screen, so I always know which column is which.
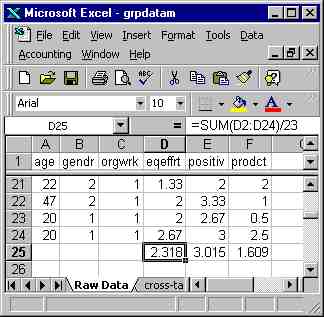
Run your cursor down to the first "break," where the value of orgwrk changes from 1 to 2. Place your cursor to the left of the row immediately below the row of labels (on the "2"), click on "Window," then on "Split." Insert two blank rows, then place the cursor in the first blank row, immediately below the first variable, eqeffrt.
Back up in the toolbar, click on the capital Sigma, for sum. A moving dotted line should surround all the entries for eqeffrt for people who responded "Independently" on "Groups." In the formula box at the top, you should see =SUM(D2:D24), where "2" is the first row of your actual data and "24" is the last row of data for orgwrk = 1.
Place your cursor at the end of this formula, insert a slash (for divide
by) and enter the number of subjects in the group, orgwrk=1. The
completed formula will look like this: =SUM(D2:D24)/23. Hit
enter, and the mean for "eqeffrt" will be automatically calculated.
Now, copy the same formula under each of the other variables (Excel will automatically adjust it by changing the column letter as you drag the formula across.) Go down to the end of the "orgwrk=2" group and repeat the process, then go down to the end of "orgwrk=3" and repeat the process.
You now have means for each of the variables for each group.
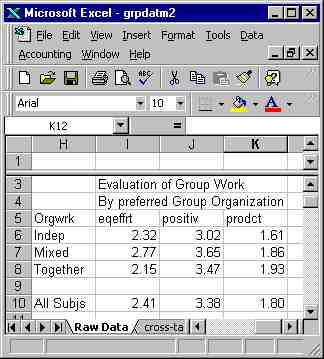
When you copy these means into a table, you will get something like the table to the right. Notice that I have rounded everything to two decimal places; since comparisons will actually be made at the first decimal place, you might round to one.
I have made a bar chart to illustrate; you might also consider a line chart.
To make a chart or graph, highlight the labels and data, and click on the chart symbol on the toolbar. You will be presented with a choice of chart types; I continued with the defaults all the way through.
You can edit the chart after it has been made, by clicking the cursor on the part you want to edit. If you save the chart on a separate sheet, it will be full size; for this illustration I chose to save it on the data sheet, which produced a small chart. I also stretched the chart vertically to make it more readable.
Interpretation
Now that I have analyzed the data, what does it mean? What is the answer to my question? It appears that with respect to evaluation of the product, there is very little difference among groups, but with respect to equality of effort and feeling that the group experience was positive, people who organize their group to work together on most parts of the project, but in subgroups or independently on some parts ("mixed") feel better about the outcome.
As with the example of cross-tabs, I also need to consider whether these results are just evidence of random events, or represent real differences in the sample. If I had a representative sample rather than a sample of convenience, I would do an Analysis of Variance (ANOVA), to compare the difference between subgroups to the variance within subgroups. Although ANOVA is beyond the scope of this class, an illustration of how to conduct one using SPSS will be found in the SPSS illustration. Suffice it to say that the results would be statistically significant (if the data came from a random sample) for equality of effort and positive group experience but, as I expected, not for evaluation of the product.
Notice that it really wouldn't make sense to compare the results for any of the three outcome measures, because we have no way of knowing whether the scales are in any way comparable. I have no way of determining whether any particular subject felt that the group experience was more positive than the quality of the product.
Communication Studies
Mainpage
![]() (PSU
Home Page)
(PSU
Home Page)
This page is maintained by David Ritchie, e-mail:
cgrd@odin.cc.pdx.edu
Last updated on July 29, 1999.